
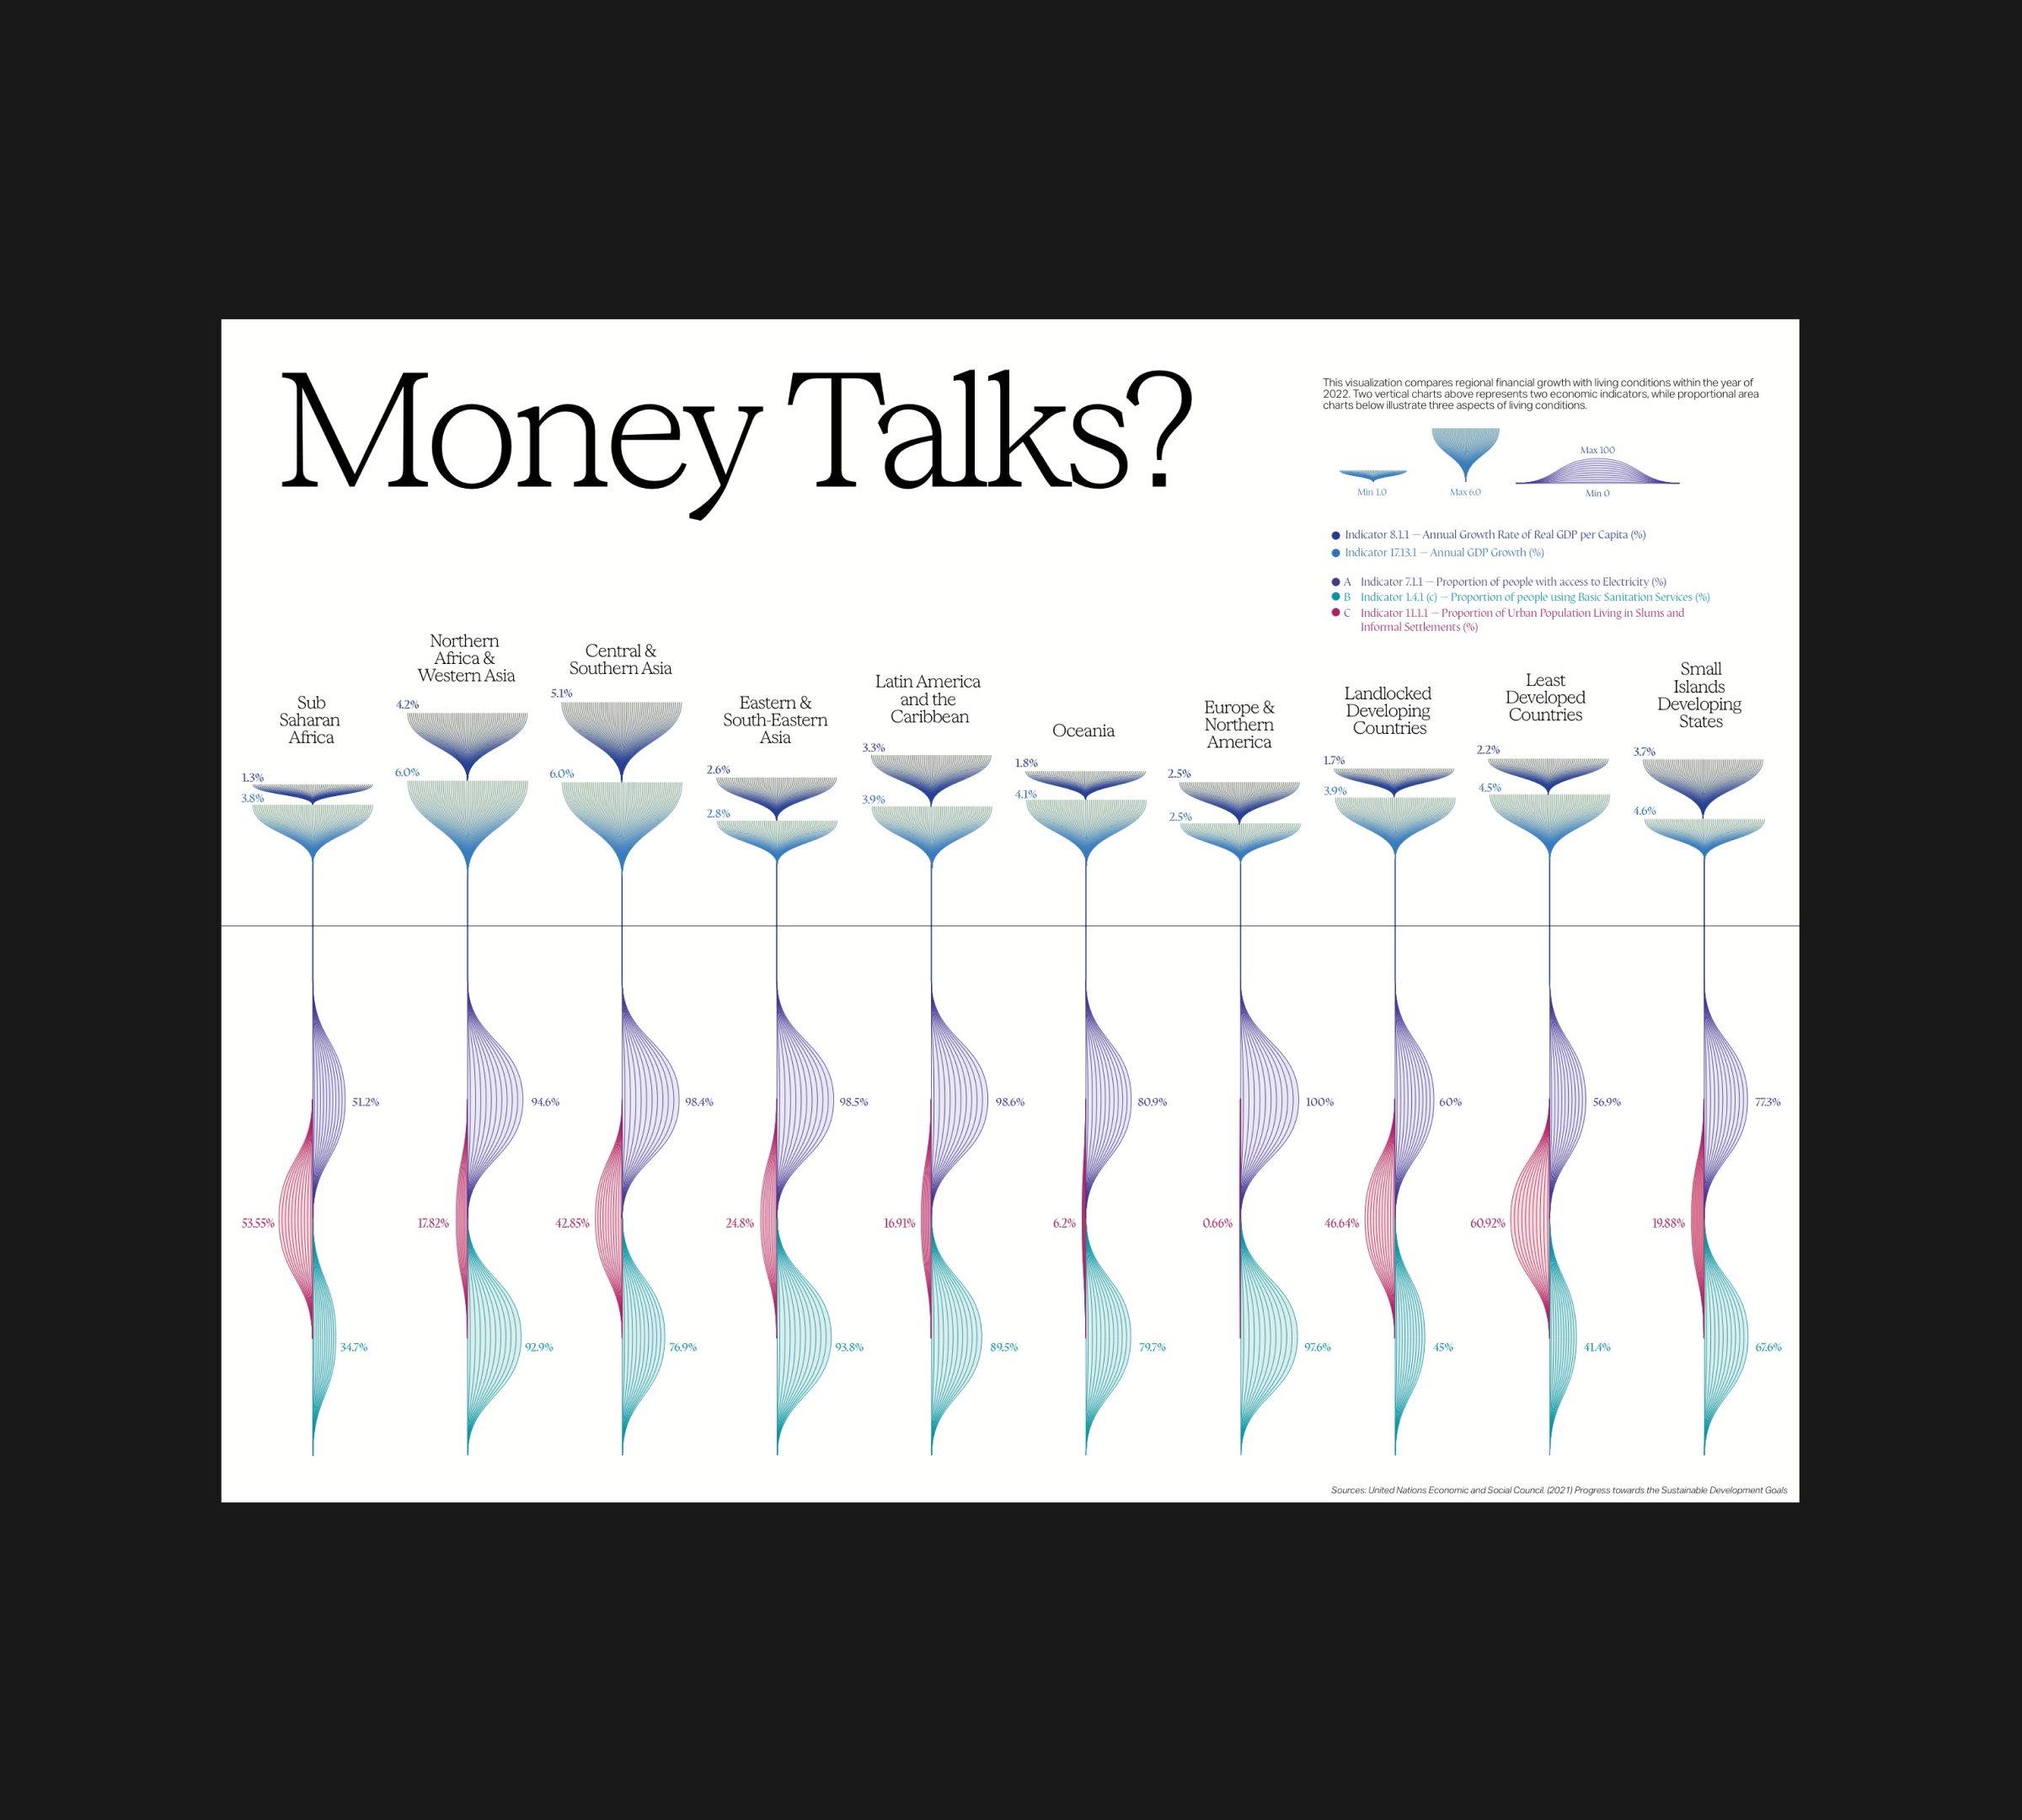
Money Talks?

Website
Department
Design
Program
Design (BDes)
Graduate Year
2027
Specialities
Branding / Information Design


Design
Design (BDes)
2027
Branding / Information Design

